Customer Challenges
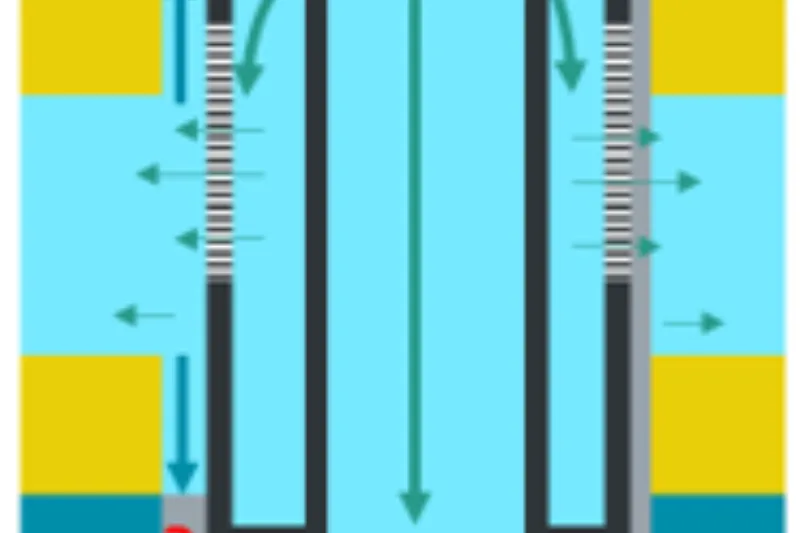
- A multi‑zone water injector was deployed to maintain reservoir pressure and support field‑wide production optimization. The well was completed with multiple Sliding Side Doors (SSDs), all open during injection, allowing commingled injection across several sand intervals. While injection allocation was estimated from open‑hole permeability‑based models, the actual distribution of injected water both by zone and within individual sand layers behind the tubing remained unknown
- Conventional injection surveys such as PLT can provide rate distribution through each SSD, but they offer limited visibility into how injected fluids are distributed behind the casing, particularly within layered sands
- The objective of this study was to identify not only injection allocation by zone, but also the effective injection intervals behind the tubing, using DFOS to reveal fluid movement and subtle thermal responses associated with injected water
Expro Excellence
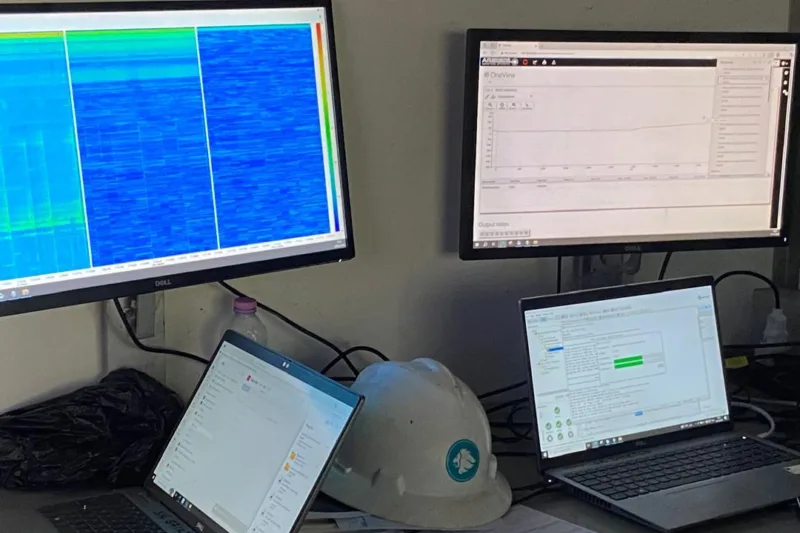
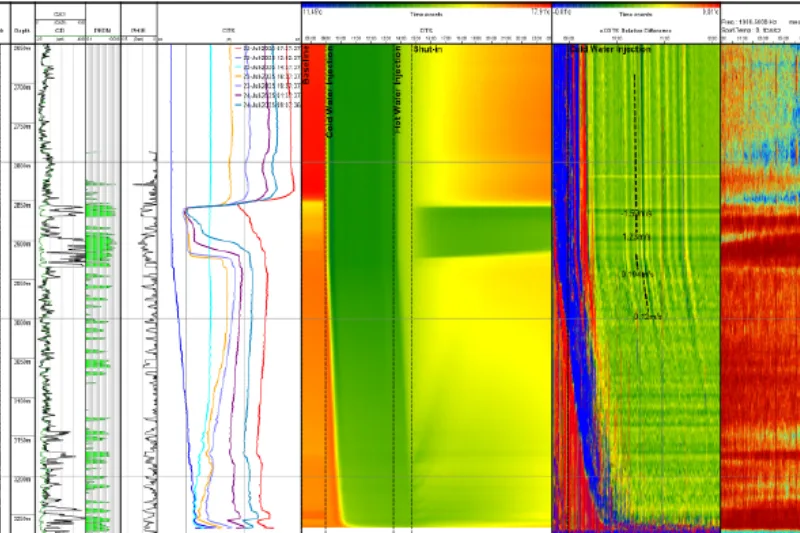
- Expro deployed an integrated DFOS surveillance solution with simultaneous acquisition of DTS and DAS, with DAS data processed using Low‑Frequency DAS (LF‑DAS / eXDTS). This configuration provided the high sensitivity and spatial resolution required to detect small temperature differences and slow f luid movement, critical for identifying injection distribution behind the pipe
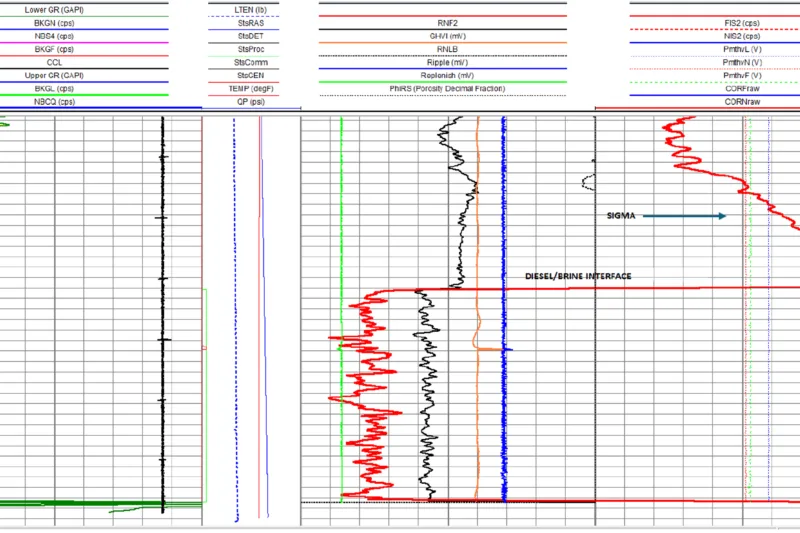
- Depth correlation was established using temperature profiles and GR‑CCL measurements, aligning open‑hole GR data to DTS and subsequently to DAS/eXDTS. The acquisition program consisted of a baseline, two injection rates separated by shut‑in periods, followed by a dedicated warm‑back DFOS acquisition. Continuous DFOS monitoring throughout the sequence enabled both dynamic injection analysis and post‑injection thermal evaluation
- Injection rates were quantified using eXDTS slope‑based flow analysis, while temperature contrast observed during injection and warm‑back periods was used to identify the effective injection intervals within the sand layers behind the tubing
Value to Client
- Delivered formation‑level insight into behind‑tubing injection distribution, moving beyond SSD‑level allocation provided by conventional surveillance
- Clearly identified which sand layers were actively receiving injected water, distinguishing effective injection zones from non‑participating intervals
- Reduced uncertainty in sand‑level injection distribution within commingled completions
- Enabled improved understanding of reservoir pressure support efficiency and injection effectiveness
- Provided critical insight unattainable with PLT‑only injection surveys • Supported more informed injection strategies and long‑term reservoir management decisions
Contact
For further information, please contact wellintervention@expro.com.